반응형
am은 "ante meridiem"을, 즉 "오전"을 나타내고, pm은 "post meridiem"을, 즉 "오후"를 나타냅니다.
반응형
am은 "ante meridiem"을, 즉 "오전"을 나타내고, pm은 "post meridiem"을, 즉 "오후"를 나타냅니다.
토토리
acorn
ReDim은 VBA에서 동적 배열의 크기를 변경할 때 사용되는 키워드입니다. Dim을 사용해 배열을 선언할 때 크기를 미리 지정하지 않고, 코드 실행 중 필요한 크기로 배열을 조정할 수 있습니다.
다음은 동적 배열을 ReDim으로 설정하고 변경하는 예입니다.
Sub Example()
    Dim myArray() As Integer ' 크기를 지정하지 않은 배열 선언

    ' 배열의 크기 설정 (초기 크기: 5)
    ReDim myArray(1 To 5)
    myArray(1) = 10

    ' 배열 크기 재설정 (변경된 크기: 10)
    ReDim myArray(1 To 10)
End Sub
기존 데이터가 있는 배열 크기를 변경하면서 데이터를 유지하려면 ReDim Preserve를 사용해야 합니다. Preserve를 붙이지 않으면 배열의 모든 요소가 초기화됩니다.
Sub ExampleWithPreserve()
    Dim myArray() As Integer
    ReDim myArray(1 To 5)
    myArray(1) = 10

    ' 배열 크기 변경, 기존 데이터 유지
    ReDim Preserve myArray(1 To 10)
End Sub
| 확장 영역 자동 선택 (0) | 2024.11.28 |
|---|---|
| [직장인 필수] 엑셀 VBA 자동화, 이 영상으로 마스터하세요! | 초보자 맞춤, 4시간 완성 코스 (0) | 2024.11.27 |
| V=range("NFE")와 V=range("NFE").Value의 차이점 (0) | 2024.11.10 |
| VBA 코드에서 언더스코어(_)의 기능 (0) | 2024.11.09 |
| 변수명 A와 A()의 차이 (0) | 2024.11.08 |
V = Range("NFE")와 V = Range("NFE").Value는 엑셀 VBA에서 셀 값을 변수에 저장할 때 약간의 차이가 있습니다.
Dim V As Range
Set V = Range("NFE") ' Range 객체를 참조
MsgBox V.Value ' V를 통해 해당 셀의 값에 접근Dim V As Variant
V = Range("NFE").Value ' NFE 셀의 값만 가져옴
MsgBox V ' 셀의 값 표시따라서, 단순히 셀의 값을 가져오려는 경우 V = Range("NFE").Value를 사용하는 것이 적합하며, 셀의 다른 속성이나 셀의 범위를 직접 제어하려면 V = Range("NFE")와 같이 Range 객체 참조를 사용하는 것이 좋습니다.
| [직장인 필수] 엑셀 VBA 자동화, 이 영상으로 마스터하세요! | 초보자 맞춤, 4시간 완성 코스 (0) | 2024.11.27 |
|---|---|
| ReDim의 주요 목적 (0) | 2024.11.11 |
| VBA 코드에서 언더스코어(_)의 기능 (0) | 2024.11.09 |
| 변수명 A와 A()의 차이 (0) | 2024.11.08 |
| Option Explicit 사용하는 이유는? (0) | 2024.11.07 |
VBA 코드에서 **언더스코어(_)**는 줄 바꿈 문자로 사용됩니다. VBA에서는 한 줄에 모든 코드를 작성해야 하는 제한이 있기 때문에, 코드가 길어질 경우 언더스코어를 사용해 다음 줄로 이어서 작성할 수 있습니다. 이를 통해 코드의 가독성을 높일 수 있습니다.
언더스코어를 줄의 끝에 넣고 다음 줄에서 코드를 계속 작성하면 됩니다. 이때, 언더스코어 앞뒤에는 반드시 공백이 있어야 합니다.
Sub Example()
    Dim total As Integer
    total = 10 + 20 + 30 + _
            40 + 50 + 60 ' 언더스코어로 줄 바꿈
    MsgBox total
End Sub긴 조건문을 언더스코어를 사용해 여러 줄로 나눌 수도 있습니다.
If total > 0 And total < 100 And _
   total Mod 10 = 0 Then
    MsgBox "조건이 만족되었습니다."
End If
| ReDim의 주요 목적 (0) | 2024.11.11 |
|---|---|
| V=range("NFE")와 V=range("NFE").Value의 차이점 (0) | 2024.11.10 |
| 변수명 A와 A()의 차이 (0) | 2024.11.08 |
| Option Explicit 사용하는 이유는? (0) | 2024.11.07 |
| 변수명 끝에 &와 # (0) | 2024.10.23 |
VBA에서 변수명을 A로 선언하는 것과 A()로 선언하는 것에는 중요한 차이가 있습니다.
Dim A As Integer
A = 10 ' 단일 정수 값을 저장
Dim A(1 To 5) As Integer ' 5개의 정수를 저장할 수 있는 배열
A(1) = 10 ' 첫 번째 요소에 값 할당
A(2) = 20 ' 두 번째 요소에 값 할당
배열의 크기를 코드 실행 중에 변경하고 싶다면, 동적 배열을 사용할 수 있습니다. 다음과 같이 ReDim을 사용하여 배열의 크기를 지정할 수 있습니다.
Dim A() As Integer
ReDim A(1 To 5) ' 배열의 크기 설정
따라서, A와 A()는 사용 목적과 저장 방식에서 큰 차이가 있습니다. A()는 특히 다수의 데이터를 효율적으로 관리할 때 유용합니다.
| V=range("NFE")와 V=range("NFE").Value의 차이점 (0) | 2024.11.10 |
|---|---|
| VBA 코드에서 언더스코어(_)의 기능 (0) | 2024.11.09 |
| Option Explicit 사용하는 이유는? (0) | 2024.11.07 |
| 변수명 끝에 &와 # (0) | 2024.10.23 |
| Mohr's circle VBA code (0) | 2023.06.16 |
Option Explicit는 VBA 코드의 맨 위에 선언하여 사용자가 모든 변수를 명시적으로 선언하도록 강제하는 명령어입니다. 이를 사용하는 이유는 다음과 같습니다:
Option Explicit

Sub Example()
    Dim total As Integer
    total = 10 ' 모든 변수를 미리 선언해야 하므로 실수 방지 가능
    Debug.Print total
End Sub
Option Explicit를 사용하지 않으면 코드 오류를 사전에 방지하기 어려워지고, 예상치 못한 동작이 발생할 수 있습니다.
| VBA 코드에서 언더스코어(_)의 기능 (0) | 2024.11.09 |
|---|---|
| 변수명 A와 A()의 차이 (0) | 2024.11.08 |
| 변수명 끝에 &와 # (0) | 2024.10.23 |
| Mohr's circle VBA code (0) | 2023.06.16 |
| VBA를 사용하여 X 축과 Y 축의 범위 값을 가져오기 (0) | 2023.06.14 |
엑셀 VBA에서 변수명 끝에 & 또는 #를 붙이는 것은 해당 변수가 특정 데이터 유형을 나타내도록 명시하는 방식입니다. 이를 통해 VBA가 변수의 유형을 추론하지 않고, 명확하게 지정된 유형을 사용할 수 있게 합니다. 주요 기호는 다음과 같습니다:
& : Long (긴 정수) 데이터 유형을 나타냅니다.
# : Double (배정밀도 부동소수점) 데이터 유형을 나타냅니다.
이러한 접미사는 변수를 선언할 때나 값을 대입할 때 사용될 수 있습니다. 예를 들어:
Dim numLong&
Dim numDouble#
이렇게 하면 numLong은 Long 타입으로, numDouble은 Double 타입으로 선언됩니다. 데이터 유형을 명시적으로 지정하면 메모리 사용량을 줄이고, 코드 실행 속도를 높일 수 있습니다.
| 변수명 A와 A()의 차이 (0) | 2024.11.08 |
|---|---|
| Option Explicit 사용하는 이유는? (0) | 2024.11.07 |
| Mohr's circle VBA code (0) | 2023.06.16 |
| VBA를 사용하여 X 축과 Y 축의 범위 값을 가져오기 (0) | 2023.06.14 |
| 엑셀 차트크기 조절 VBA (0) | 2023.04.04 |
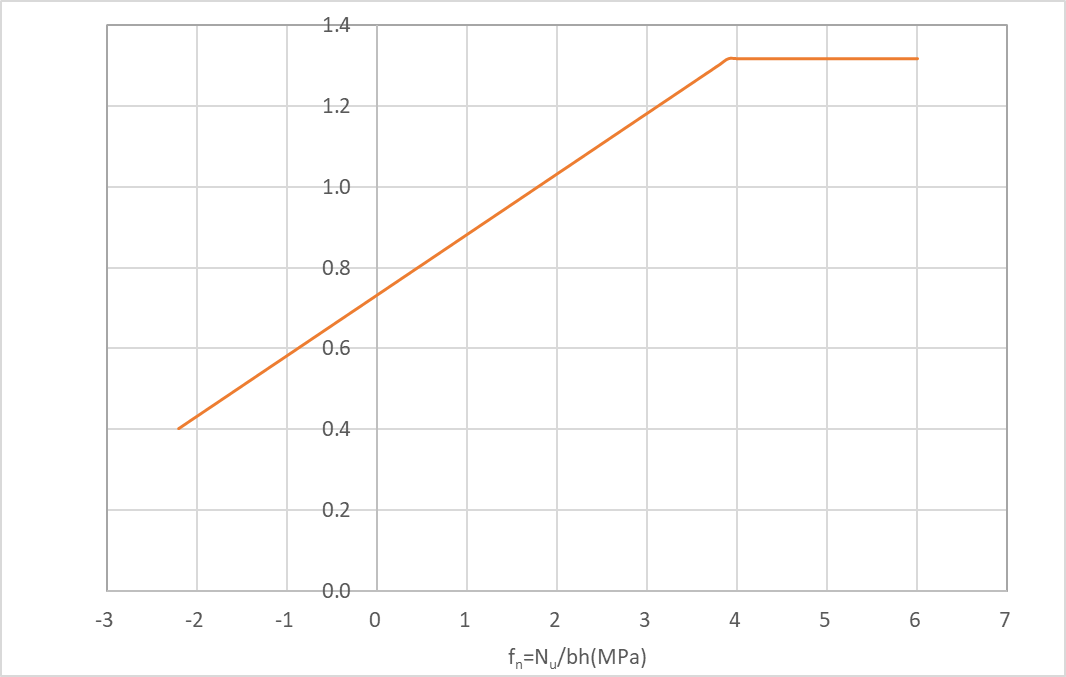
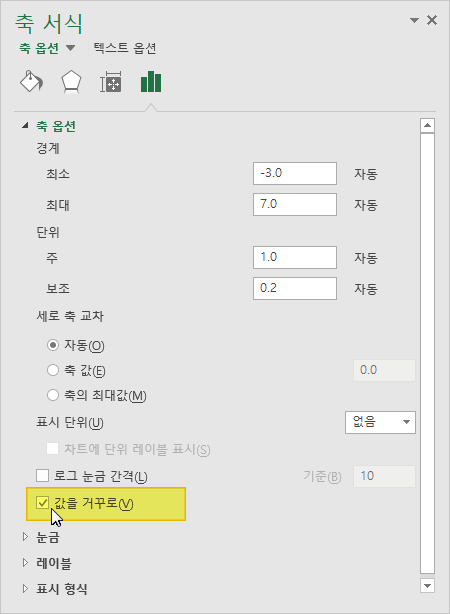
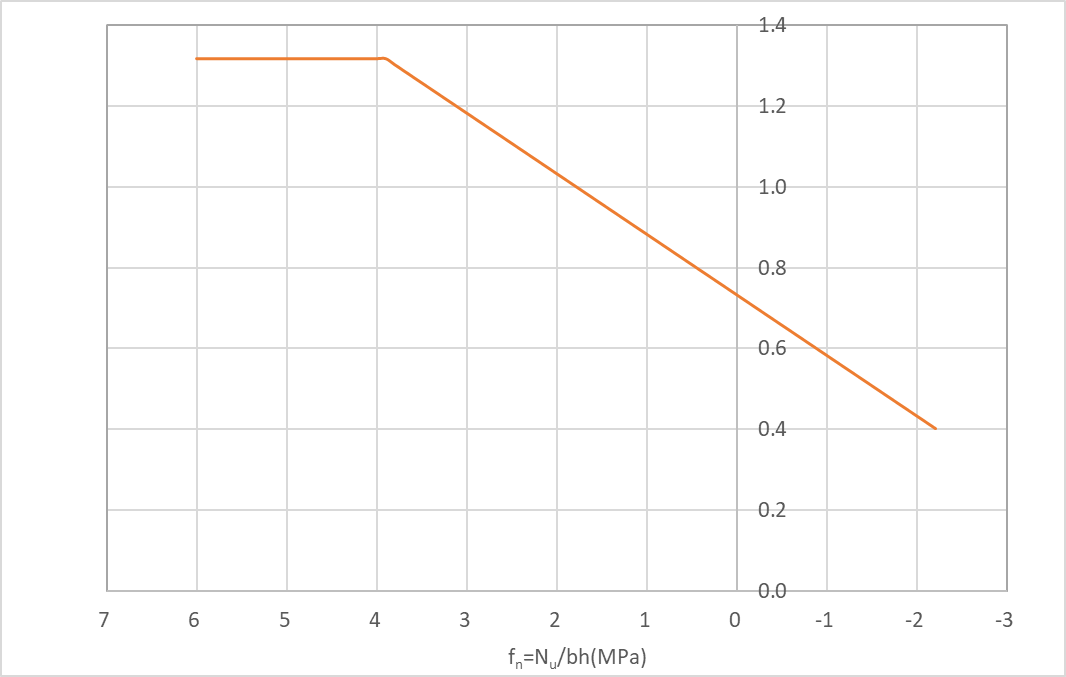
엑셀 그래프(챠트)에서 X축을 Y축을 기준으로 반전 시키고 싶다.
1. X축을 선택하여 축서식 클릭
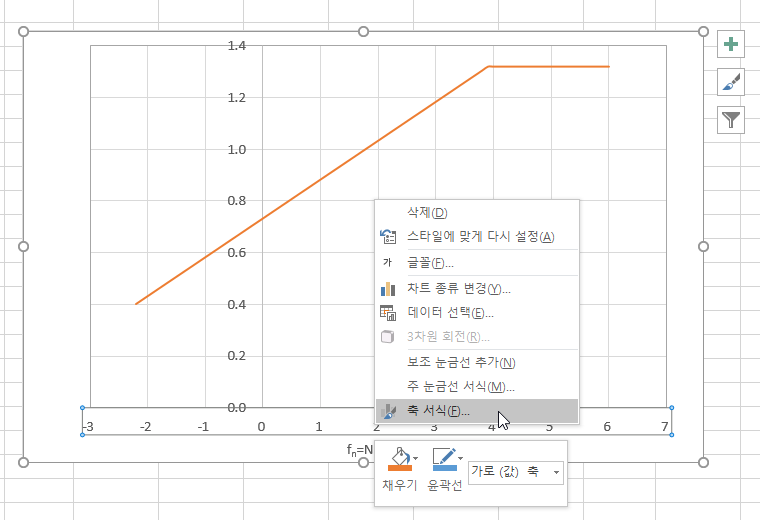
2. 축 옵션에서 값을 거꾸로 클릭
3. 그래프의 X축이 좌우 반전되었다.
| 특정 날짜가 그해의 몇 번째 날인지 계산 (0) | 2025.01.15 |
|---|---|
| 첫번째 열에서 n번째 열까지의 합 (0) | 2024.09.19 |
| 엑셀 열너비 복붙 ctrl+w (0) | 2024.09.17 |
| 가장 가까운 짝수로 올림하기 (0) | 2024.07.30 |
| 보조 가로 축 추가하기 (0) | 2024.06.20 |
A1에서 XFD1에 숫자가 입력되어 있다. B1셀에 숫자 n을 입력하면 그 숫자만큼 첫번째 열에서 n번째 열까지의 합을 구하고 싶다.
Excel에서 B1 셀에 입력된 숫자 nnn 만큼 첫 번째 열(A1)에서 n번째 열까지의 합을 구하는 방법은 SUM 함수를 사용하여 다음과 같이 구현할 수 있습니다.
=SUM(A1:INDEX(1:1, B1))
이 수식을 사용하면 B1에 입력된 숫자에 따라 A1에서 n번째 열까지의 합계를 동적으로 계산할 수 있습니다.
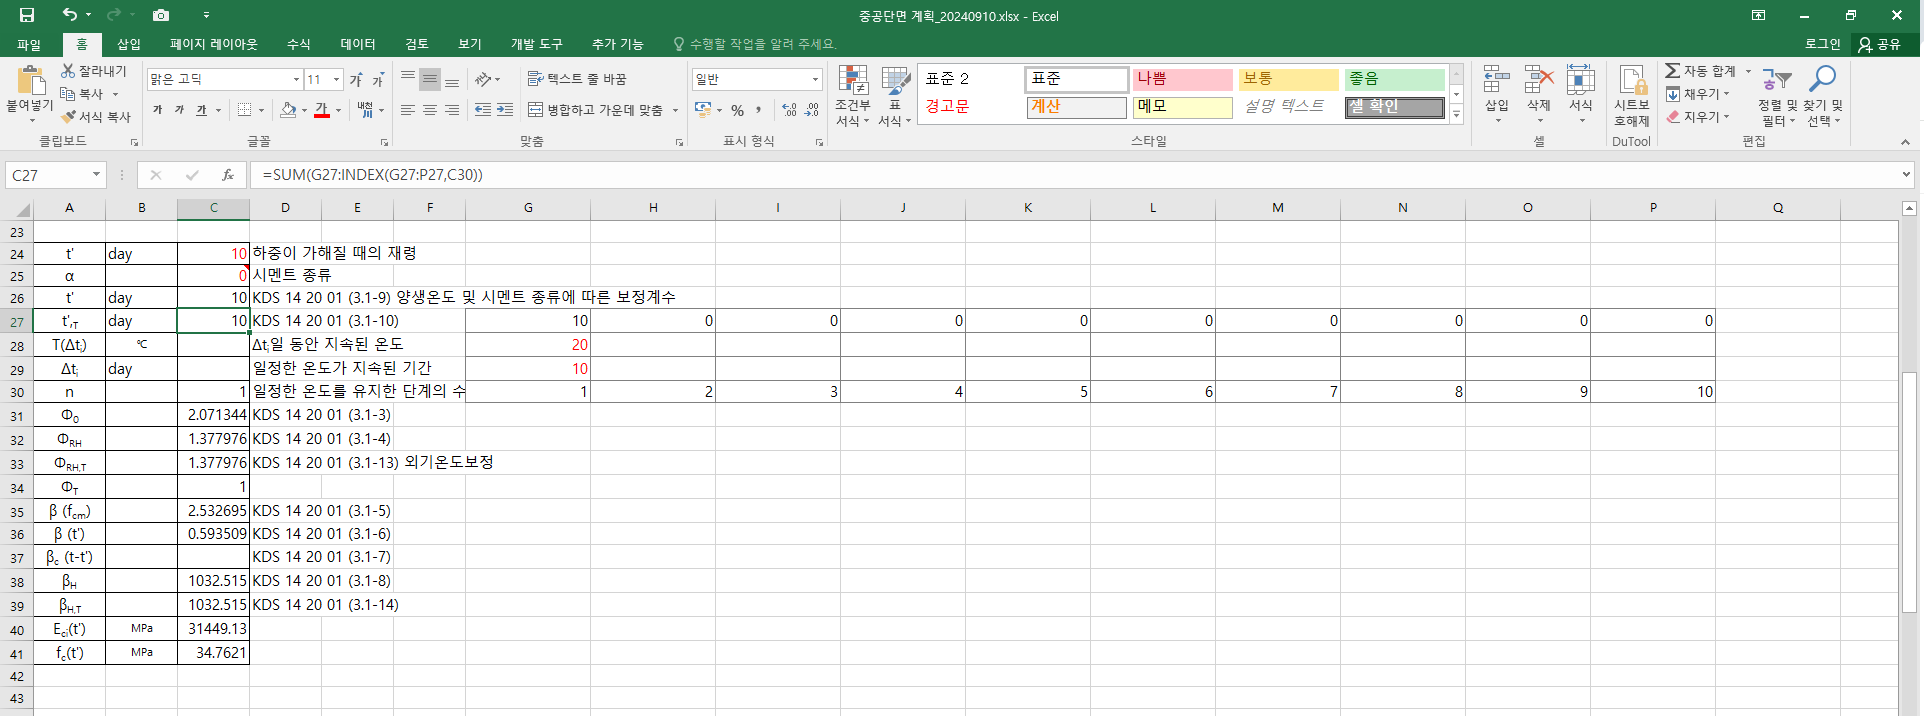
=SUM(G27:INDEX(G27:P27,C30))
| 특정 날짜가 그해의 몇 번째 날인지 계산 (0) | 2025.01.15 |
|---|---|
| 엑셀 그래프 x축 반전 (0) | 2024.10.07 |
| 엑셀 열너비 복붙 ctrl+w (0) | 2024.09.17 |
| 가장 가까운 짝수로 올림하기 (0) | 2024.07.30 |
| 보조 가로 축 추가하기 (0) | 2024.06.20 |